In my last post, I dived deep into the topic of whether Communication Design can stimulate behavioural change, while focusing specifically on sustainable behaviour. From this, it becomes clear that graphic means could possibly aid a behavioural change by sensitizing people, creating awareness, engaging them emotionally or translating complex matters into a language comprehensible to the target audience.
As a next step for my research, I decided to dive into the practical field again and look at some examples, where those notions were put into practice.
Infographic” Urban Water Needs—Can We Keep Up? (Increase in Urban Domestic Water Use by 2030)” by Matt and Hal Watts
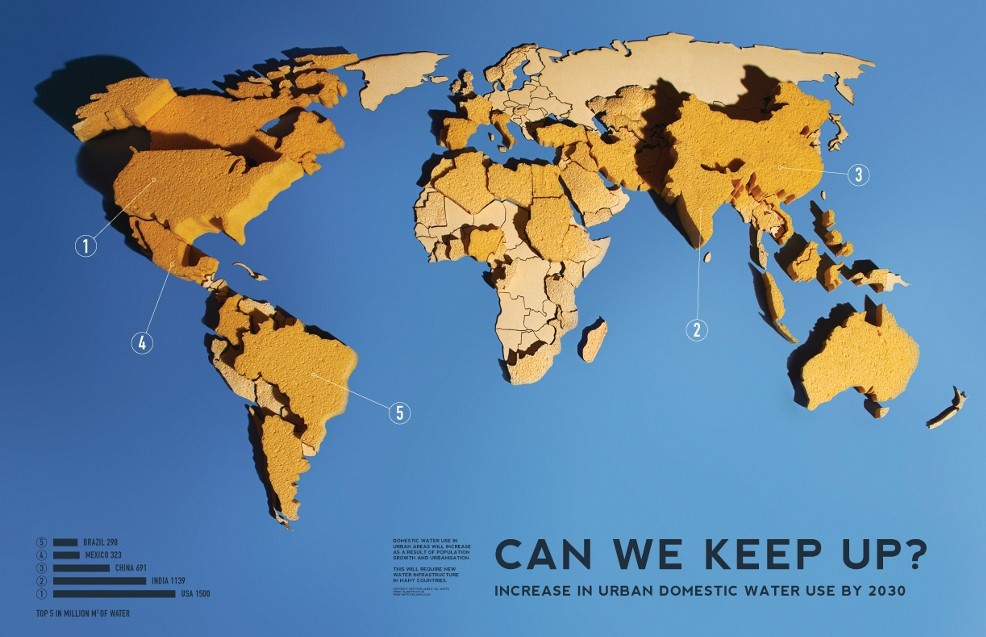
The infographic by Matt and Hal Watts showcases beautifully how Communication Design can aide translating a complex topic into an image I can grasp within seconds: the bigger the sponge, the higher the urban domestic water use increase.
Poster series “Soup” by Mandy Barker

Video “There’s a monster in my kitchen” by Greenpeace International
This video from Greenpeace raises awareness for deforestation and uses a beautiful emotionally-laden visual language reminiscent of children’s books.
Website “addresspolution.org”
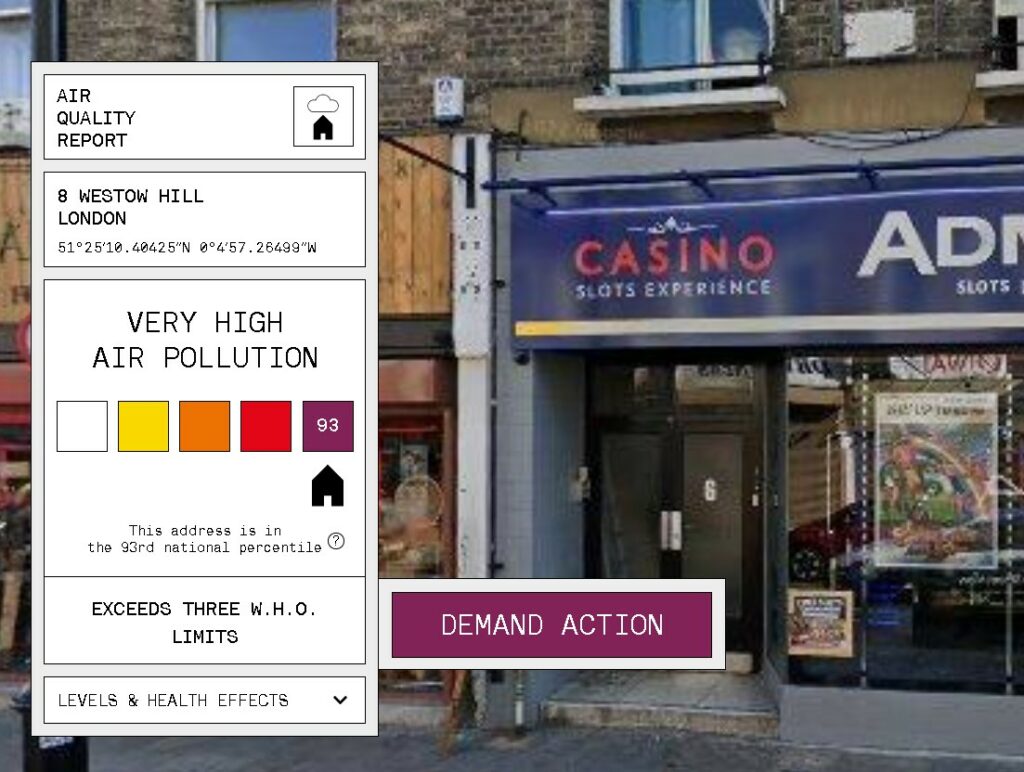
The website “addresspollution.org” lets residents of London enter their address and returns the air pollution score. With this, the users can see the direct effect pollution has on their very own lives.
References
- Barker, M. (n.d.). Soup [Poster]. Mandy Barker. https://www.mandy-barker.com/soup-2.
- Central Office of Public Interest (2022). [Screenshot of the website addresspollution.org]. Central Office of Public Interest. https://addresspollution.org/results/f0e570ee-f242-4e38-8a0e-9431f4676bed.
- Greenpeace International. (2020). There’s a monster in my kitchen . YouTube AT. https://www.youtube.com/watch?v=prg24EWHNJg.
- Watts, H., Watts, M. (2011). Can We Keep Up? Increase in Urban Domestic Water Use by 2030 [Infographic]. circle of blue. https://www.circleofblue.org/2011/world/infographic-can-we-keep-up-increase-in-urban-domestic-water-use-by-2.