In this blogpost I want to give insights in the first of my two topics I researched during this semester. A concept for a hands-on exhibit in the context of science education.
Concept
A physical representation of an iceberg that will change its shape and texture according to the ongoing process of ice melting in real life because of climate change. Together with an interactive soundscape of ice cracking visitors get a multisensory experience.
Interactivity will either be realized by controlling the melting process by turning a wheel which symbolizes the time in years or voting on climate related questions by placing the hand on a reactive surface.
Texture
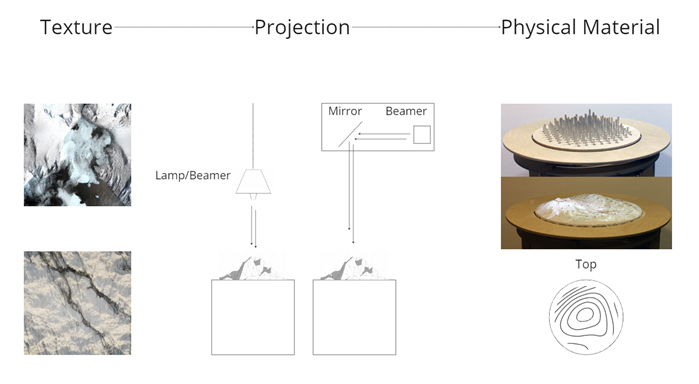
The texture being projected on the mesh will simulate the sun casting shadows on the lower parts of the iceberg. Furthermore, the texture will change as the shape changes and visualize the transition from ice to water and cracking ice sheets. Based on my interviews, a grayscale texture will be the preferred method if done in real time processing. If the textures will be pre rendered, further research and comparison on visibility between grayscale and color will be necessary.
Projection
The projection will be made from the ceiling. However, as in figure 1 shown, there are two possibilities to hide the beamer. While the first approach will mask the beamer with a lampshade the second will hide the beamer in the ceiling and project with the help of a mirror on top of the mesh.
Physical Material
The physical representation will be realized with sticks and an elastic mesh on top. The sticks will be connected to small motors that pull or push the stick individually. With this approach the shape can be changed and simulate the melting process.
A realization of the mechanics can be seen under the following link: https://vimeo.com/125111011#t=590s