Current State

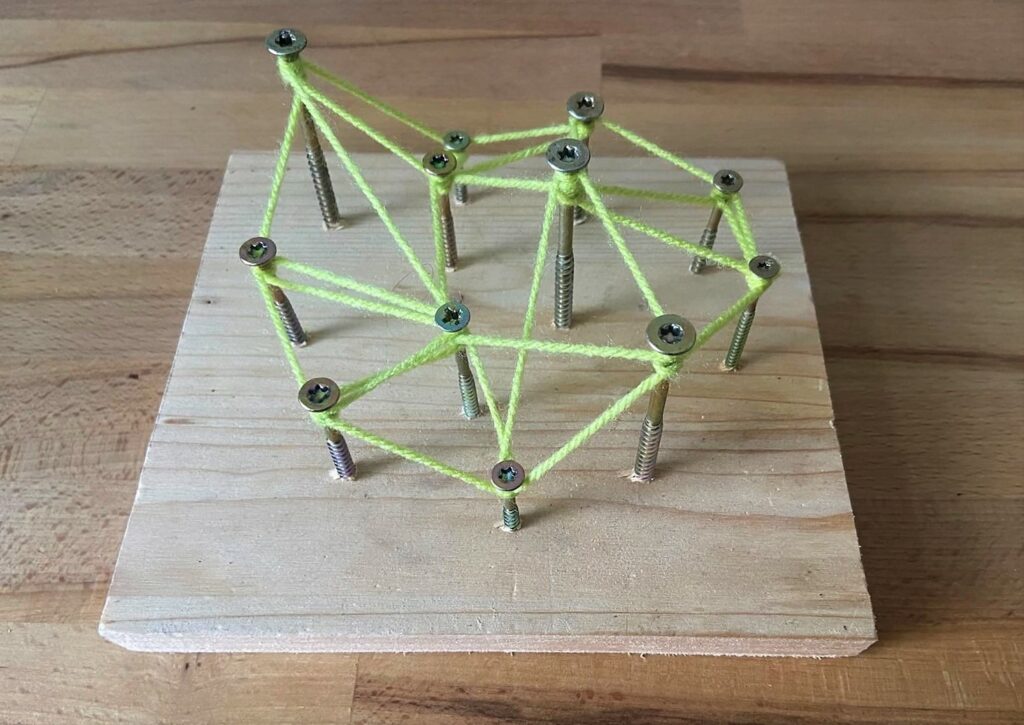
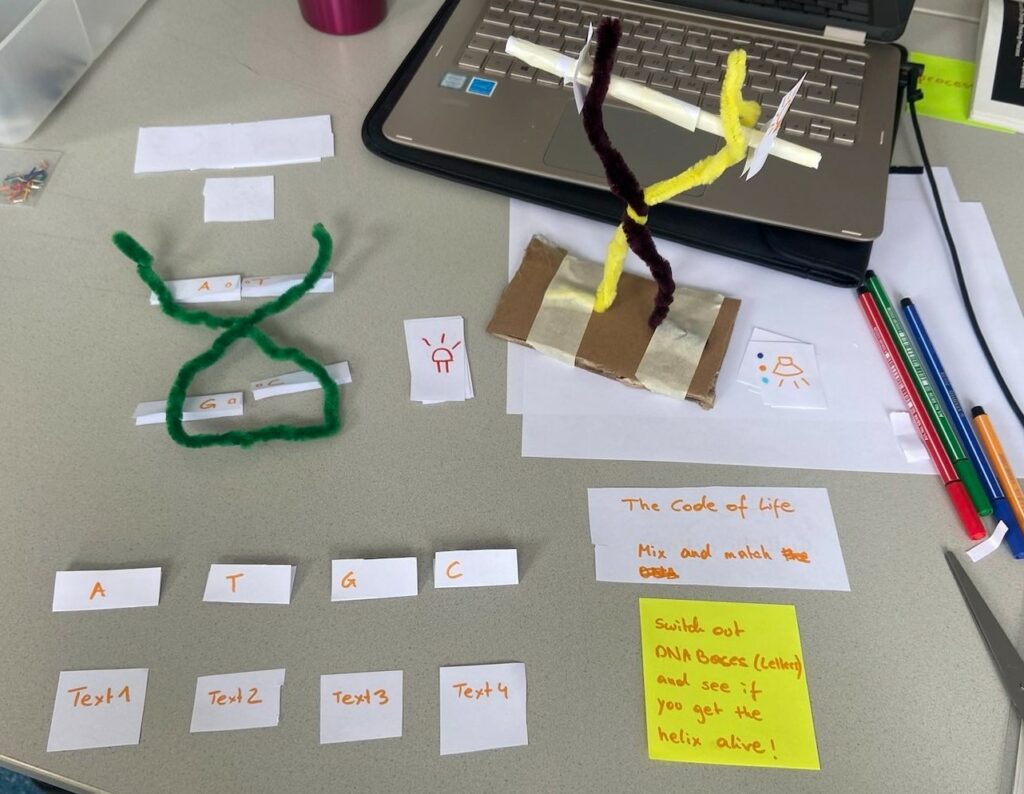
In my last blogpost for this semester, I will summarize my findings and ideas, introduce the second version of my prototype and give a short outlook on my plans for the next semester.

I started working on tangible user interfaces in the beginning and shifted my focus from image recognition and marker detection as a potential user interface to the question how data visualization can be made more physical.

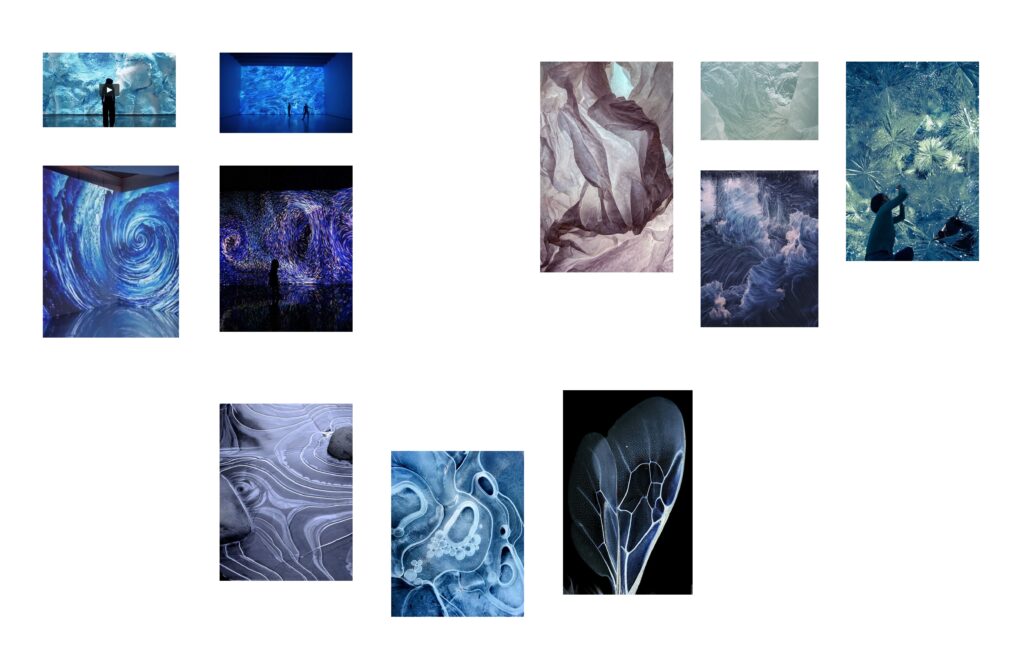
So, the topic I will focus on are icebergs.

How did their mass change over time?
How are we as humans responsible?
How can we provoke change and call to action?

Moreover, I have found various Experts who currently research on icebergs. To get insights into their latest research findings I am planning to conduct expert interviews with them soon.
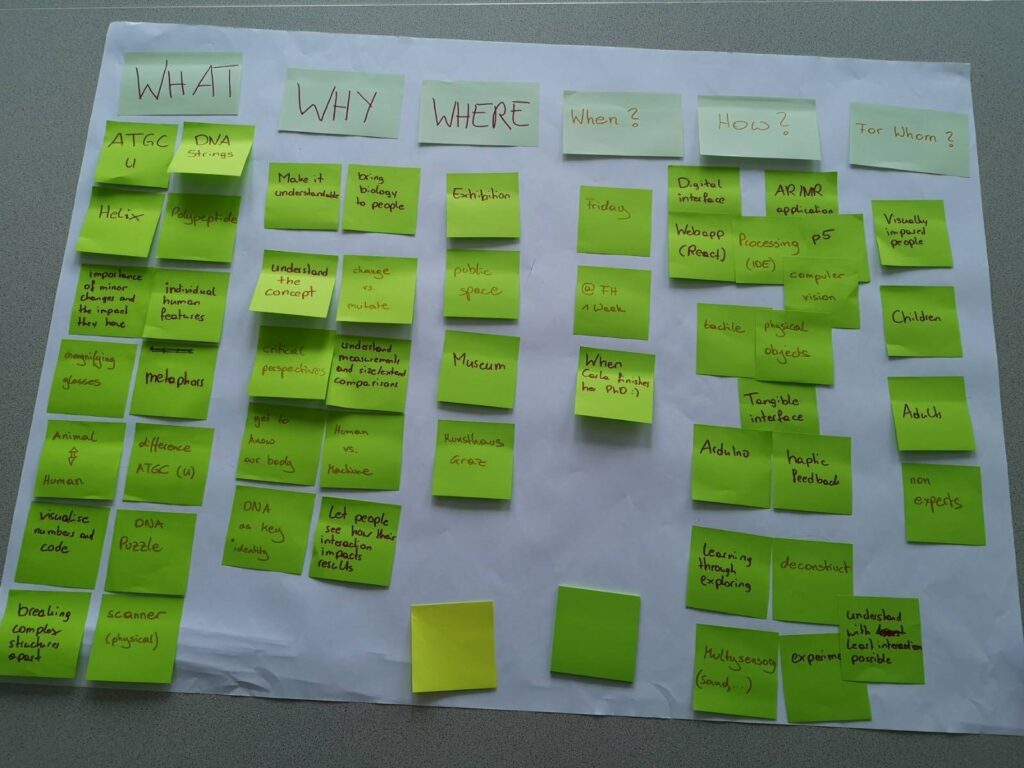
Miro Board

To merge my current research findings with those from last semester I made a Miro Board where I summarize my findings from both semesters. It can be accessed with the following link:

https://miro.com/app/board/uXjVP407Veo=/?share_link_id=883470200121

Video

I also made a short video where I introduce my project:

https://fhjoanneum-my.sharepoint.com/:v:/g/personal/edwin_lang_edu_fh-joanneum_at/ESRrN2lxslBLhFFnyQT7HxQBDw0QcxsXDfowIXVzM4KJ3A?e=WLhvvb

Prototyping Overview

Until now the focus of my research was about communicating social and environmental problems with the help of tangible user interfaces. In this blogpost I want to concretize my current topic of my master thesis and focus on one specific environmental problem – “melting ice sheets and their impact on sea level rise – starting a so called “chain reaction”.

So how should such an exhibit be designed, to not only offer great experience but also stating a call to action?

What is the perfect symbiosis between the digital and analog medium for communicating sensitive topics like climate change?

Staying true to the concept of multisensory experiences I would like to create an exhibit that has the following layers of abstraction:

Physical feedback

For the physical representation of an ice cap, I want to build a three-dimensional model out of sticks covered by an elastic mesh. The height of the sticks can be controlled separately with a motor, giving the impression of a shape changing constantly.

c Edwin Lang

Audio feedback

By recording the cracking of an ice bucket with contact microphones, I want to create a sound similar to a cracking ice cap.

https://freesound.org/embed/sound/iframe/268023/simple/large/

Video feedback

In terms of video, I want to project morphing organic shapes onto the physical representation of the ice cap. The shapes could be generated with programs like OpenFrameworks and real data sets of melting caps[1]. With the help of machine learning and algorithms the complexity of the data sets could be drastically reduced – however further research and testing is needed[2].

Credits images: https://pin.it/4OqiwA6


User Interface

The visitors should be able to see changes of the ice cap based on their ecological footprint. The ecological footprint gives an indicator on the greenhouse gas emissions, can be converted to emitted energy and further be linked to the capability of melting ice.

The interface itself has yet to be explored but will be of great importance to successfully link the individual ecological footprint with the ice cap and make the visitors emotionally bonded to the exhibit.

References:

[1] https://umap-learn.readthedocs.io/en/latest/
[2] Algorithmus: https://umap-learn.readthedocs.io/en/latest/

Workshop Week

This blogpost is about my experience I made in a workshop about “Tangible Scientific Concepts” and the Design Process it is based on. The Workshop was held by Carla Molins Pitarch who is based in Barcelona and currently finishing her PhD at the Pompeu Fabra University (Spain).

How can a code with only four letters (A, C, G, and T) create so many different proteins necessary for your body? Could we humans encode it better? The one-week workshop aims to question the current systems for encoding DNA and reconsider an infinite array of interactive visual systems with a hands-on approach and critical thinking.

In the following section I will describe the prototyping process of my group and outline what I learned during this intensive week.

The project was developed together with Theresa Dietinger and focuses on the exploration of the DNA Bases “Letters“ by trying out how the physical representations fit together.

First Phase: Ideation

In this phase we wrote all our ideas on a flipchart, clustered our interests and focused on one idea.

Second Phase: Testing

In this phase we created a wireframe prototype and performed the first user tests with our colleges to get new insights and discover problems we didn’t think of.

Third Phase: Prototyping

In this phase we developed the logical states needed to indicate whether the physical representations of the DNA Letters fit together. If the Letters don’t fit together (for example A and T) a red light will be switched on. If the Letters fit together (for example A and C) a green light will be switched.

Forth Phase: Final Prototype

Here you can see our finished prototype with the installed LEDs on both sides of the physical DNA Letters.

In this workshop I experienced the importance of simplifying complex topics as much as possible. Focusing on one specific part and making sure you don’t overwhelm your audience is the key to make them excited and raise interest for further reading at home.